|
APRIL 2022 UPDATE
By Andy Stout, CFA, CFP® - Chief Investment Officer, RAA and Allworth Financial
Inflation is everywhere: groceries, housing, gas, car prices, etc. With inflation at the highest level in 40 years, it’s hard not to notice it. In fact, even my teenagers are talking about how expensive gas prices are.
So, with inflation as a backdrop, I’ll analyze where we are today and where we could be in the future.
Inflation Today
Consumer prices have climbed at the quickest pace since 1981, surging 8.5% higher over the past year. There are numerous reasons for the pervasive inflationary environment, but thinking of it in terms of stages helps us to understand its evolution:
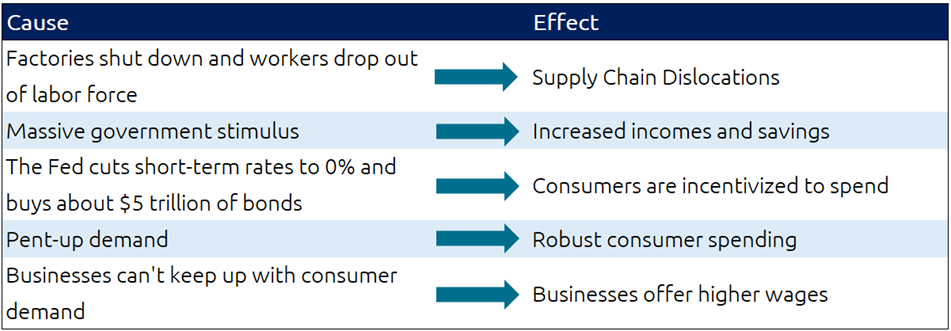
1. First, there is COVID-induced inflation:
2. Then there’s Russia’s unjustified war:
The inflationary implications of Russia’s war on Ukraine are more straightforward. Russia is one of the largest exporters of energy, wheat, and other commodities. The economic sanctions have pushed commodity prices much higher. Additionally, there are some supply chain dislocations from factories in both Ukraine and Russia.
For year-over-year inflation to decline, the upcoming monthly percentages must be lower than those months that are dropping out of the calculation. For example, the 8.5% annual inflation rate will decrease if the monthly change from April 2022 is less than the change from April 2021.
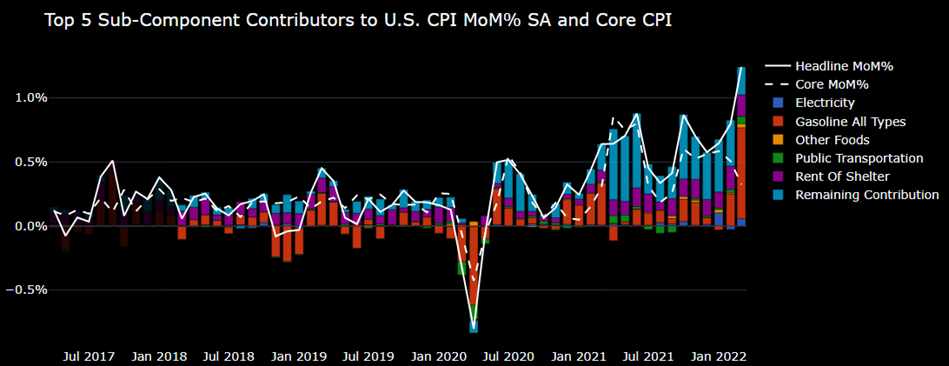
To get an idea of where we could see some relief from inflation, we should start with the recent monthly inflation drivers. The following chart shows the contributions of March’s 1.2% inflation increase compared to February. Most of that came from energy (0.8%) and shelter (0.2%). It’s unlikely that we will see much of a drop in housing, but as long as energy prices don’t skyrocket from current levels, the monthly change should drop.
While that’s where we are today, the path ahead is cloudy, and many factors will determine the outcome. So next, I’ll dive into what could go wrong, what could go right, and what we see as the more likely path.
Scenario 1: What Could Go Wrong
It’s actually fairly straightforward to see what could go wrong. First, if oil surges to $200, the cost to fill up your car would soar, as nationwide the price of gas could easily approach the nearly $6 per gallon already being seen in parts of California. (The odds of this happening would increase should Europe place a complete embargo on Russian energy products.)
This risk is somewhat mitigated by the US releasing additional oil from the Strategic Petroleum Reserve, coupled with an increase in ouput by other countries. However, it’s unlikely this production can completely replace Russia’s energy products.
A second factor that could push inflation higher is COVID. Unfortunately, this risk is playing out in real-time in Shangai. Following its zero-tolerance policy, at the end of March, the Chinese government placed its most populous city under a complete lockdown. Supply chain dislocations will only get worse the longer this drags on. For example, Apple halted production at two of its factories in the region. The result is that supply drops and so prices rise.
Shutdowns are a double-edged sword, though. Demand for commodities drops when tens of millions of people are restricted from moving, driving down commodity prices (e.g., oil). So, in other words, supply chain problems can both push goods prices higher but commodity prices lower.
Countless other factors could increase inflation; however, the most critical item to watch is inflation expectations. If consumers and businesses believe inflation will keep rising, then inflation will likely keep rising. When this happens, inflation becomes unanchored. It’s a self-fulfilling prophecy.
Here’s why:
- When consumers think prices will only go up, they will buy stuff now, pulling forward demand.
- Businesses will raise prices once they believe costs will remain elevated.
- As prices rise from the above two factors, workers will demand higher wages, resulting in a feedback loop because businesses will increase prices to keep acceptable profit margins.
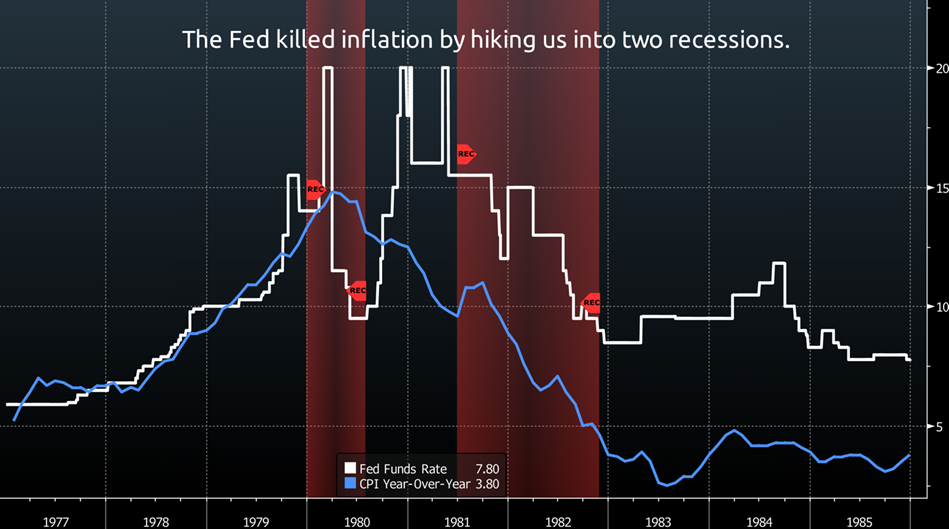
Unfortunately, at this point, the most-effective cure might be for our nation’s central bank, the Federal Reserve (Fed), to raise short-term interest rates so much that the US economy falls into a recession, collapsing demand and prices. (Which is exactly what Paul Volcker and the Fed did during the early 1980s.)
Scenario 2: What Could Go Right
If oil prices drop to about $80 per barrel, and supply chains heal in the near term, inflation expectations will remain anchored. This scenario allows the Fed to engineer a soft economic landing, avoiding a recession. Specifically, the Fed would be able to raise interest rates to the point that demand matches supply, and the economy continues to grow as inflation easily moderates.
Scenario 3: What’s More Likely
Based on today’s data, we believe what’s more likely to occur is something between these two extremes, where the year-over-year inflation readings start to trend lower in the next couple of months.
Here’s why:
1. Inflation related to core goods declined in March by 0.4%. Core goods exclude food and energy products, and this decrease suggests a deceleration in this segment. Examples of core goods are new and used cars, clothing, sporting goods, and electronics.
2. The average mortgage rate jumped from 3.3% to 5.1% since the beginning of the year, making it more expensive to service debt. In addition, housing prices have risen about 19% over the past year.
It will be difficult, if not impossible, for housing prices to sustain this growth because interest payments are much more expensive now. For example, your principal and interest payment on a 30-year fixed rate $300,000 loan would be $315 more per month compared to the beginning of the year.
3. Through the first half of the month, the average price of oil has been about $100 per barrel. Oil would need to have an average price of about $116 for the rest of the month to match March’s average oil price. So, as long as oil is relatively stable, energy prices should be a negative contributor to April’s inflation.
Barring the “what could go wrong” scenario, the three factors cited above should result in upcoming monthly inflation changes that are lower than last year: April 2021 +0.6%, May 2021 +0.7%, and June 2021 0.9%.
Year-over-year inflation would still be high, no question, but it would also be lower. As a result of the still-high inflation, the Fed would probably hike short-term interest rates at every meeting this year, including a half-point hike on May 4. Additionally, the Fed would begin to shrink its $9 trillion balance sheet by roughly $95 billion per month to help ease inflationary pressures.
Earlier in this column, I discussed the need for inflation expectations to remain anchored so that it doesn’t spiral out of control. Fortunately, expectations are anchored.
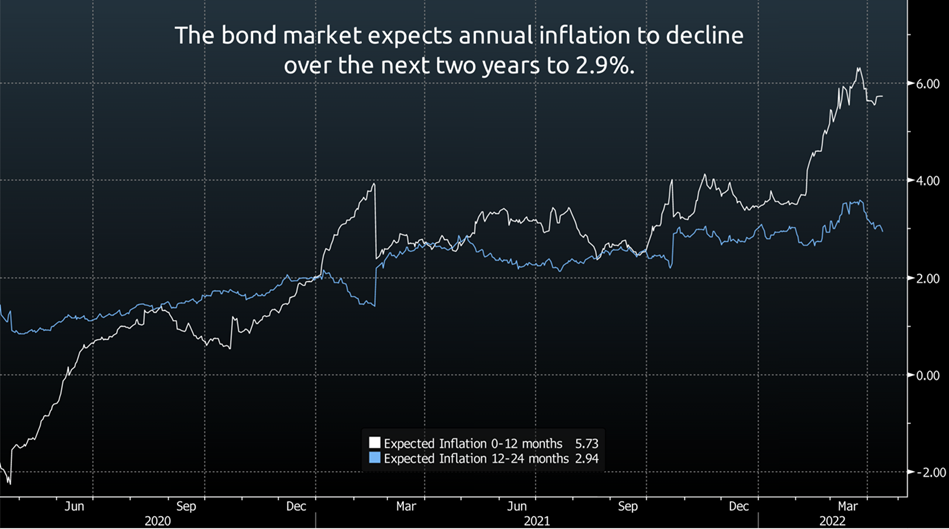
We observe this in a few ways. One is to look at the difference in yields on TIPS (Treasury Inflation-Protected Securities) compared to normal Treasury bonds. This spread tells us the amount of inflation the bond market expects. Presently, the expected consumer inflation (CPI) over the next year is 5.7%, but that falls to 2.9% for the “Year 1” to “Year 2” period.
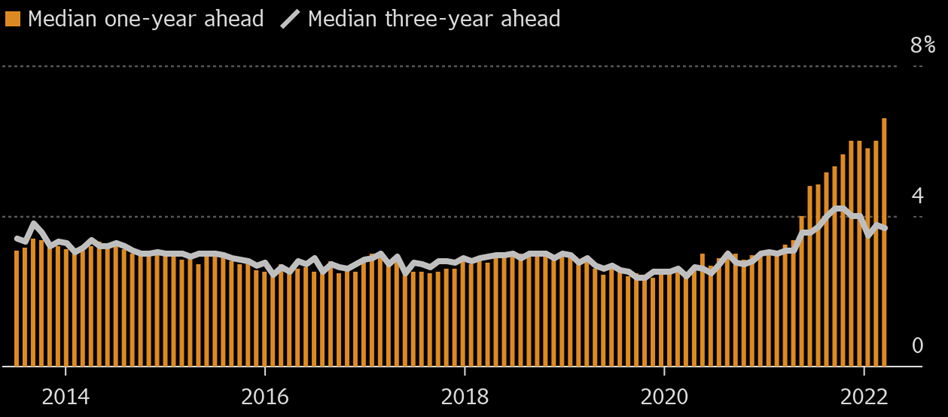
A second way to understand inflation expectations is to look at survey data. A recent survey from the Federal Reserve Bank of New York found that consumers expect inflation over the next year to come in at 6.6%; however, they expect it to drop to 3.7% in three years.
To be clear, we expect inflation will be elevated even in this more likely scenario. For example, by the end of the year, the year-over-year inflation may only have moderated to 6.5-7%. In other words, inflation will be stubbornly slow in returning to any semblance of normalcy.
As always, we at Allworth Financial will continue to closely monitor and adapt to the economic and global forces that impact inflation, investments, and the markets.
All data unless otherwise noted is from Bloomberg. Past performance does not guarantee future results. Any stock market transaction can result in either profit or loss. Additionally, the commentary should also be viewed in the context of the broad market and general economic conditions prevailing during the periods covered by the provided information. Market and economic conditions could change in the future, producing materially different returns. Investment strategies may be subject to various types of risk of loss including, but not limited to, market risk, credit risk, interest rate risk, inflation risk, currency risk and political risk.
This commentary has been prepared solely for informational purposes, and is not an offer to buy or sell, or a solicitation of an offer to buy or sell, any security or instrument or to participate in any particular trading strategy or an offer of investment advisory services. Investment advisory and management services are offered only pursuant to a written Investment Advisory Agreement, which investors are urged to read and consider carefully in determining whether such agreement is suitable for their individual needs and circumstances.
RAA and its affiliates and its employees may have positions in and may affect transactions in securities and instruments mentioned in these profiles and reports. Some of the investments discussed or recommended may be unsuitable for certain investors depending on their specific investment objectives and financial position.
RAA is an SEC-registered investment advisor that provides advisory services for discretionary individually managed accounts. To request a copy of RAA's current Form ADV Part 2, please call our Compliance department at 916-482-2196 or reply to this email.
|